
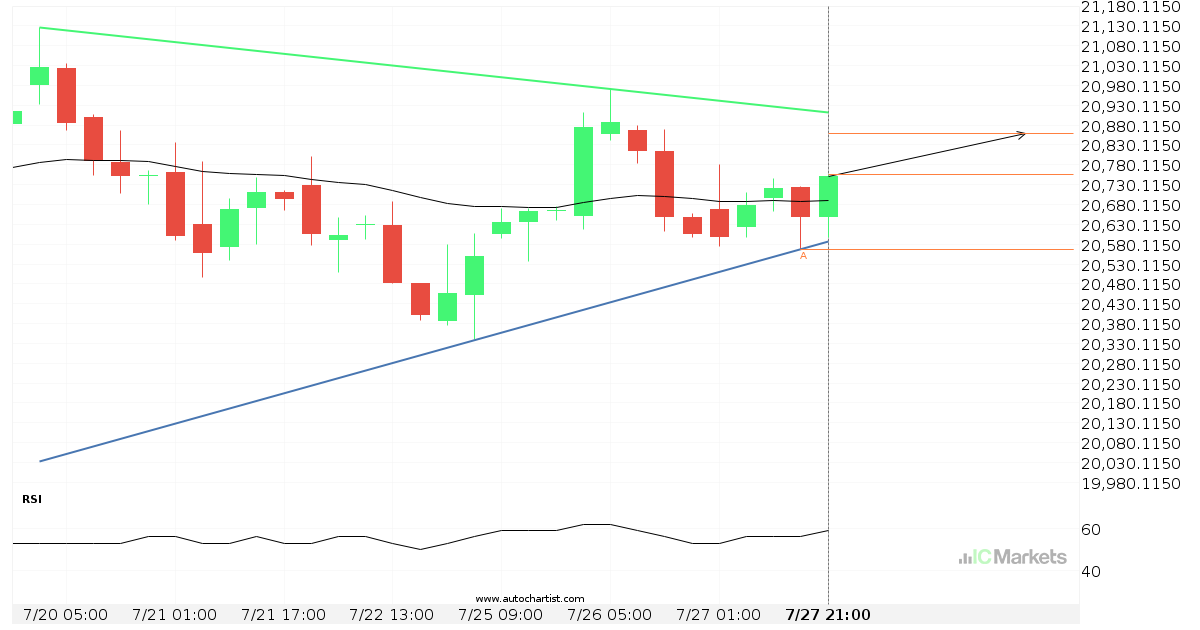
Hong Kong 50 Index – getting close to resistance of a Triangle
Hong Kong 50 Index is moving towards a resistance line. Because we have seen it retrace from this line before, we could see either a break through this line, or a rebound back to current levels. It has touched this line numerous times in the last 8 days and may test it again within the […]
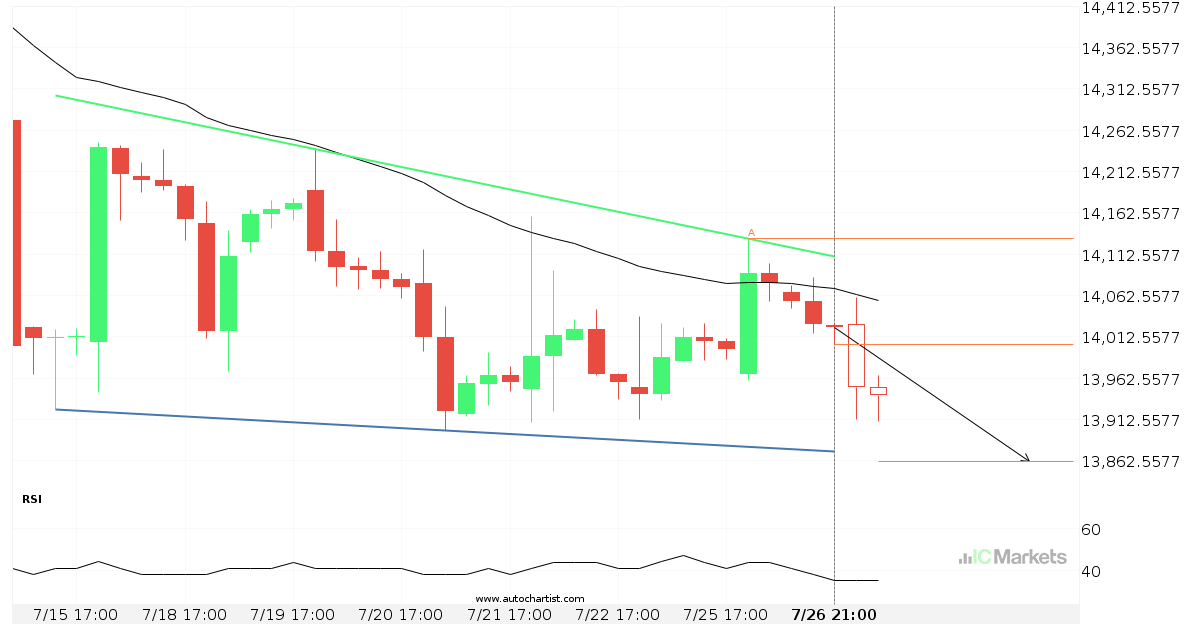
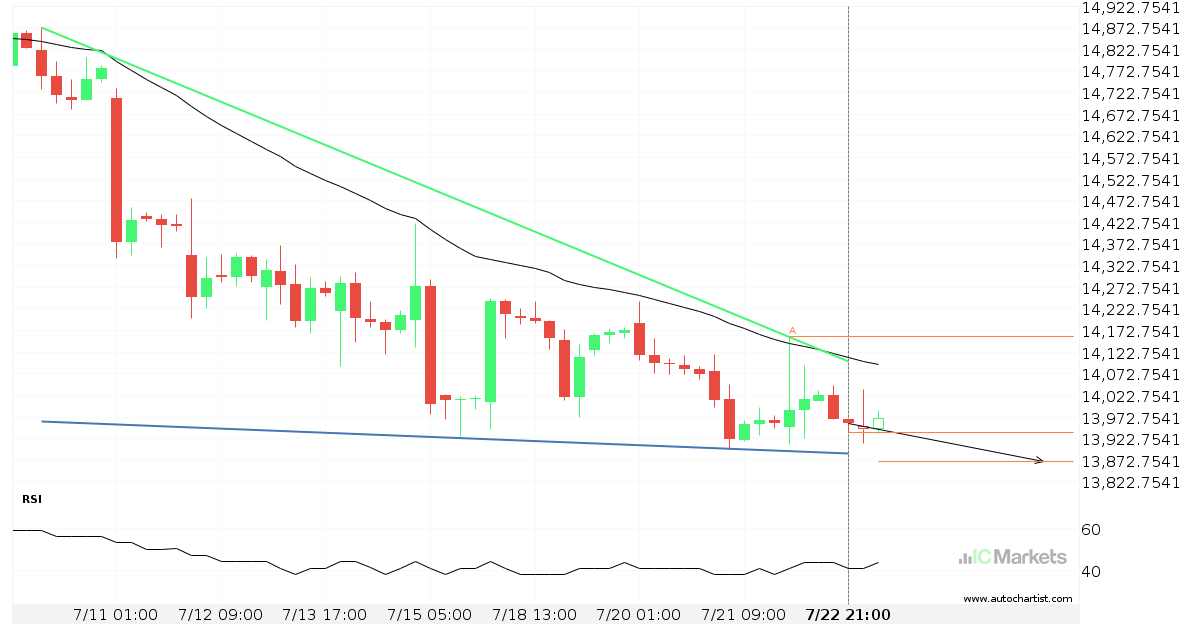
Either a rebound or a breakout imminent on FTSE China A50 Index
FTSE China A50 Index is heading towards the support line of a Falling Wedge. If this movement continues, the price of FTSE China A50 Index could test 13862.0550 within the next 2 days. It has tested this line numerous times in the past, so this movement could be short-lived and end up rebounding just like […]
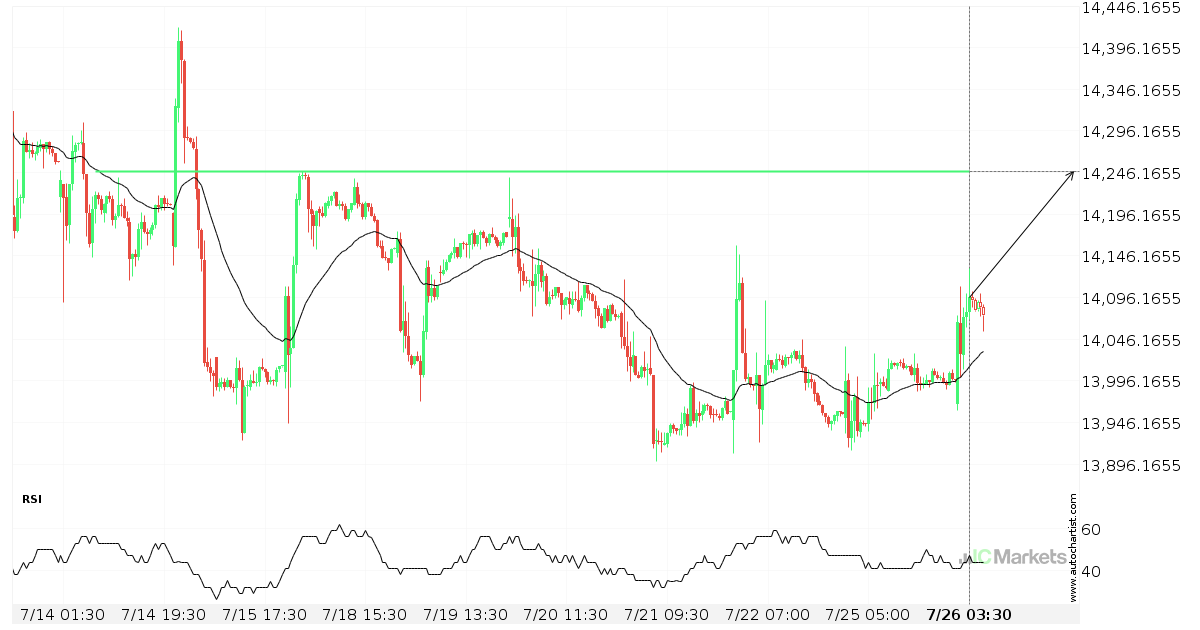
Either a rebound or a breakout imminent on FTSE China A50 Index
FTSE China A50 Index is heading towards a line of 14246.9902. If this movement continues, the price of FTSE China A50 Index could test 14246.9902 within the next 2 days. But don’t be so quick to trade, it has tested this line numerous times in the past, so this movement could be short-lived and end […]

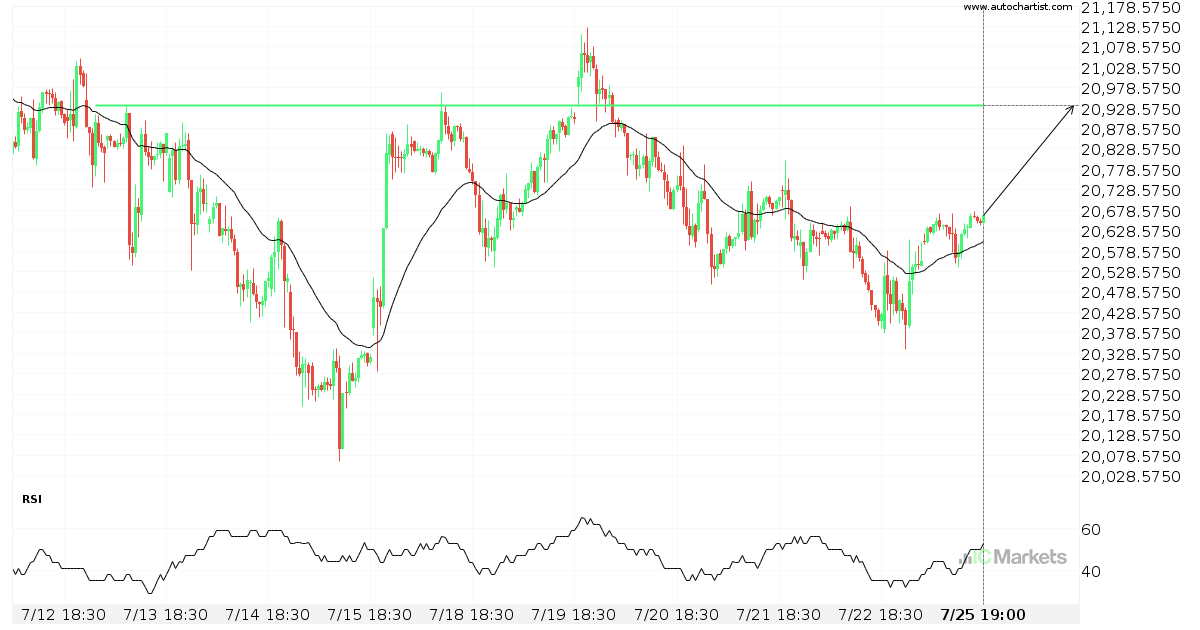
Breach of important price line imminent by Hong Kong 50 Index
Hong Kong 50 Index is moving towards a line of 20934.3008 which it has tested numerous times in the past. We have seen it retrace from this position in the past, so at this stage it isn’t clear whether it will breach this price or rebound as it did before. If Hong Kong 50 Index […]
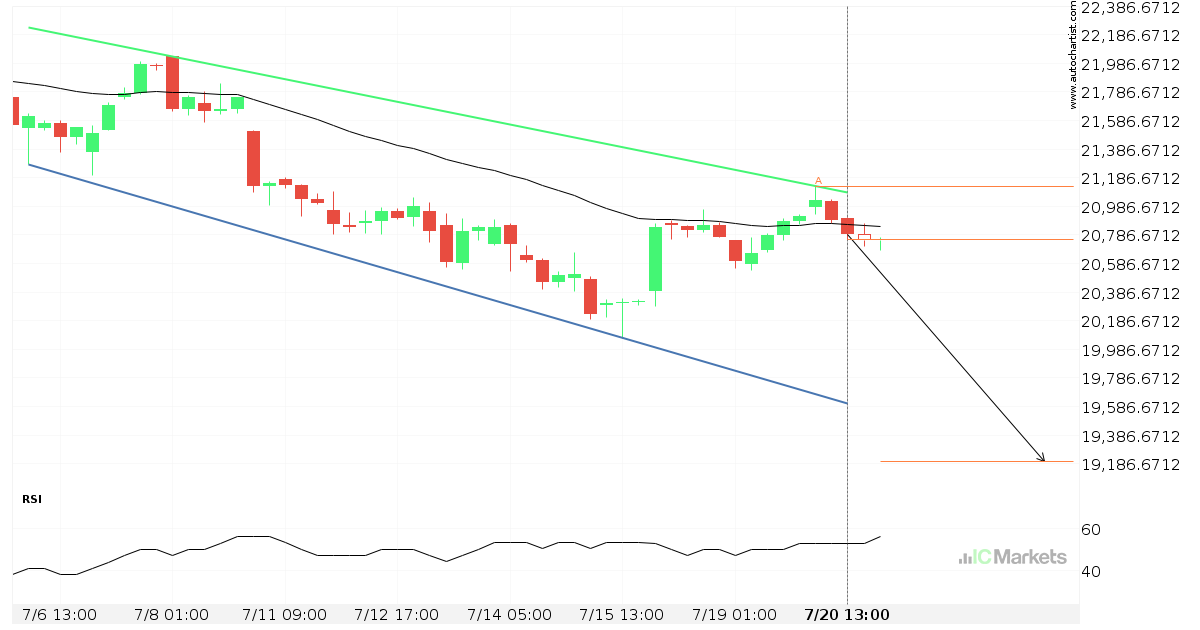
FTSE China A50 Index approaching support of a Descending Triangle
FTSE China A50 Index is approaching the support line of a Descending Triangle. It has touched this line numerous times in the last 15 days. If it tests this line again, it should do so in the next 8 hours.

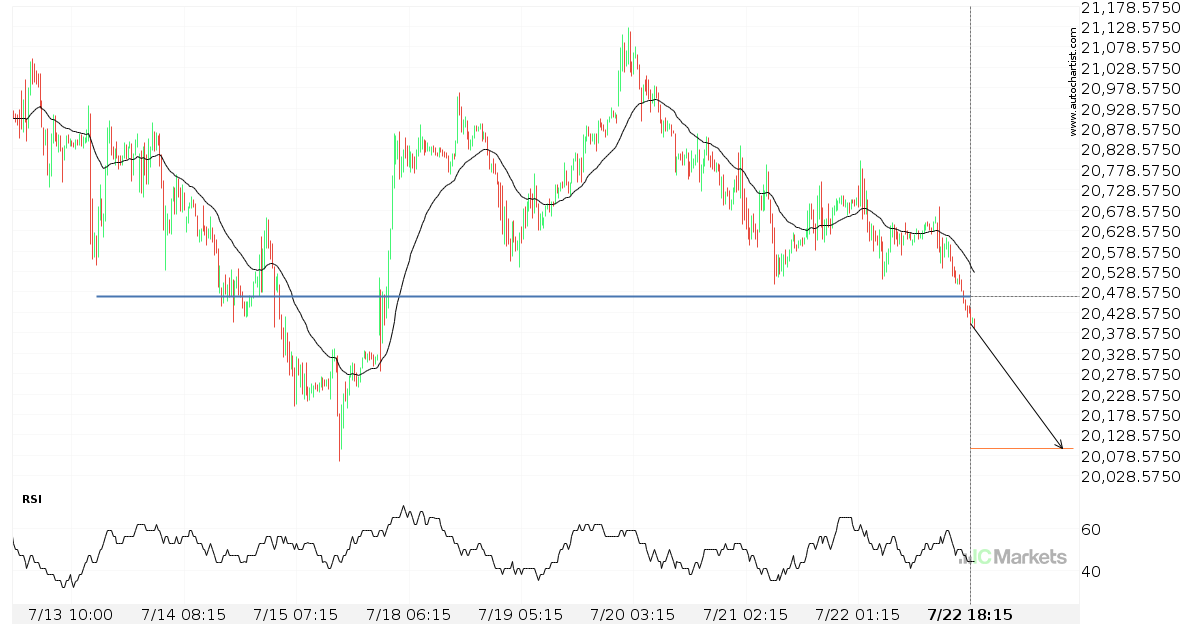
Hong Kong 50 Index broke through important 20468.4004 price line
Hong Kong 50 Index has broken through a support line. It has touched this line numerous times in the last 10 days. This breakout shows a potential move to 20095.8496 within the next 2 days. Because we have seen it retrace from this level in the past, one should wait for confirmation of the breakout.

Possible breach of support level by Hong Kong 50 Index
Hong Kong 50 Index is moving towards a support line which it has tested numerous times in the past. We have seen it retrace from this line before, so at this stage it isn’t clear whether it will breach this line or rebound as it did before. If Hong Kong 50 Index continues in its […]